2008 年
生物 · 共 58 題 · 點擊選項即時核對答案
Which of the following are reasons why bacteria can evolve rapidly in response to environmental changes?
Which of the following processes does not contribute to variations in humans?
Arrange the following steps of genetic engineering in the correct order.
(5) screen for host cells with the desired gene
The diagram below shows a kidney and some associated vessels.
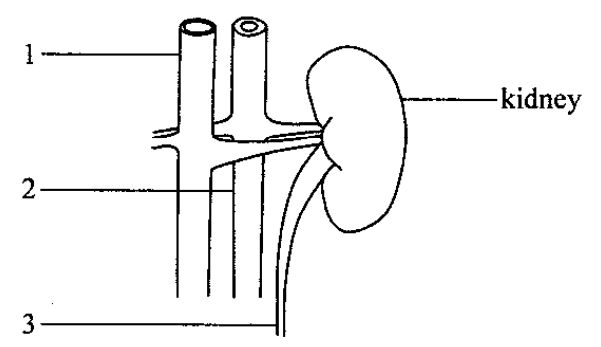
Which of the following comparisons about the amount of the substances in the associated vessels is correct?
| Higher | Lower | ||
|---|---|---|---|
| concentration of oxygen | 1 | 2 | |
| water content | 1 | 3 | |
| concentration of glucose | 3 | 1 | |
| concentration of urea | 3 | 2 |
Questions 47 and 48 refer to the diagram below, which shows a section of the eye:
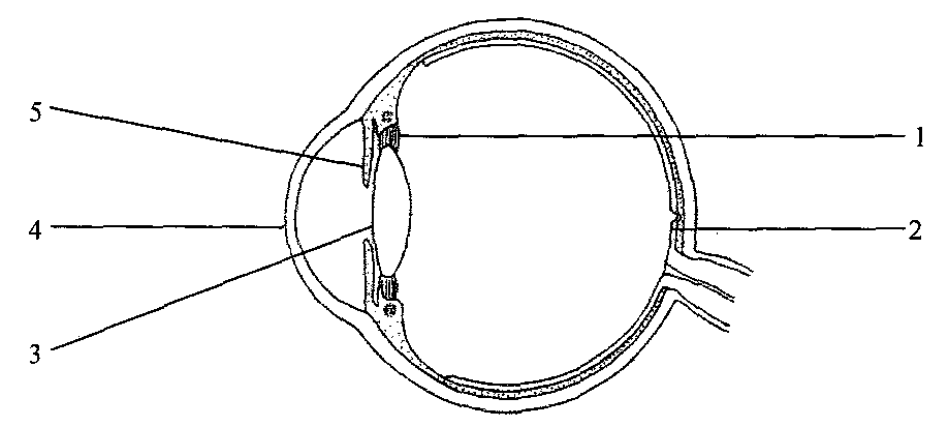
Which of the following combinations correctly describes the condition of the eye when a long-sighted person is focusing on a near object?
| Condition of structure 1 | Position where the image is focused | |
|---|---|---|
| pulled | in front of structure 2 | |
| pulled | behind structure 2 | |
| slackened | in front of structure 2 | |
| slackened | behind structure 2 |
Questions 47 and 48 refer to the diagram below, which shows a section of the eye:
Refraction of light occurs at
Which of the following comparisons about voluntary action and simple reflex action is incorrect?
| Voluntary action | Simple reflex action | |
|---|---|---|
| not inborn | inborn | |
| may involve a stimulus | involves a stimulus | |
| we are aware of the action taken place | we are not aware of the action taken place | |
| the same stimulus may lead to different responses | the same stimulus leads to the same response |
Which of the following are the advantages of asexual reproduction?
Questions 51 and 52 refer to the diagrams below. Diagram I shows the longitudinal section of a part of a root. Diagram II shows a photomicrograph of the cells taken from the root.
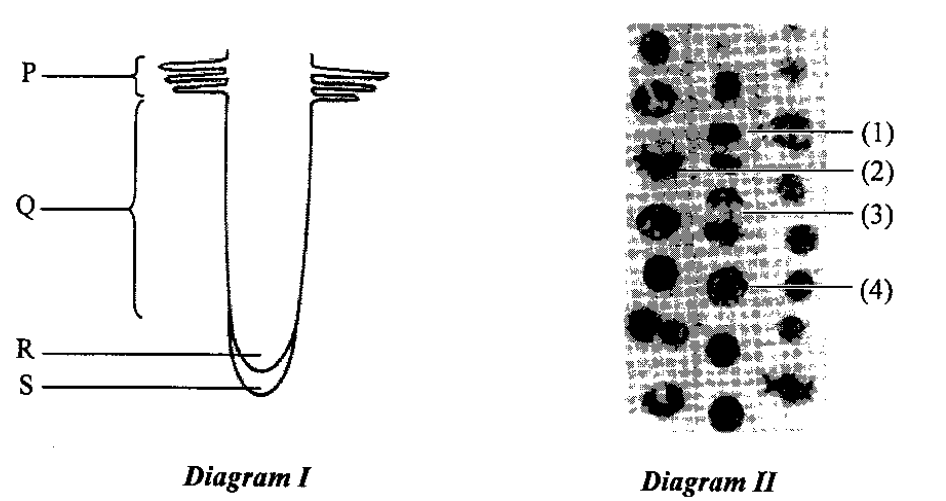
The cells shown in Diagram II are probably taken from region
Questions 51 and 52 refer to the diagrams below. Diagram I shows the longitudinal section of a part of a root. Diagram II shows a photomicrograph of the cells taken from the root.
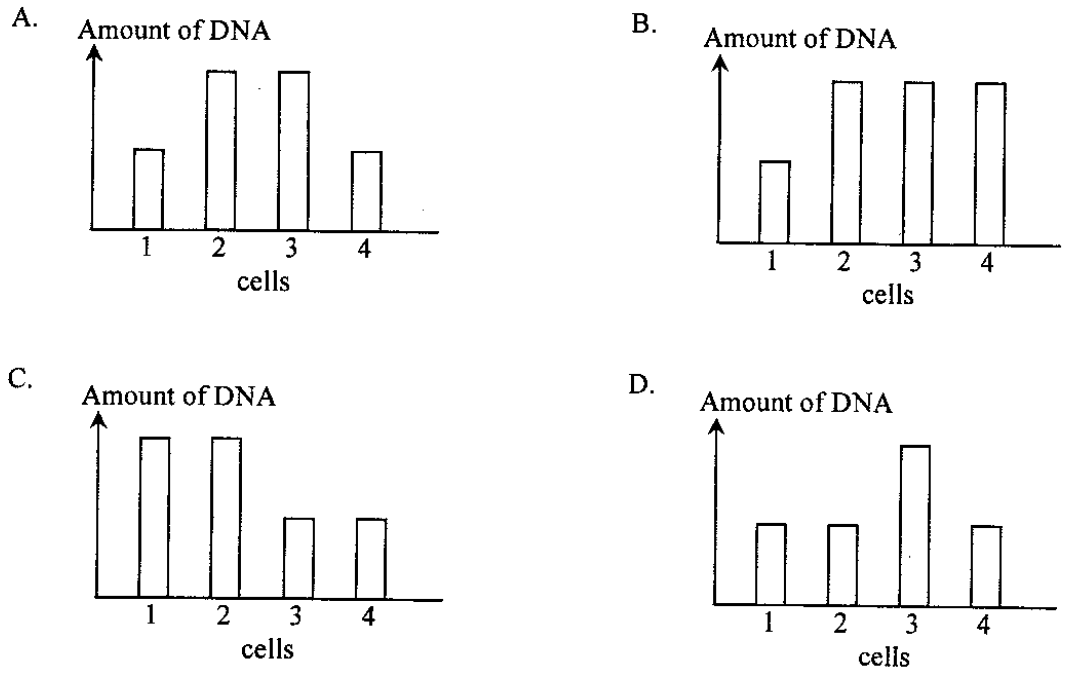
Which of the following bar charts correctly shows the relative amount of DNA present in the labelled cells shown in Diagram II?