2000 年
生物 · 共 59 題 · 點擊選項即時核對答案
Questions 52 and 53 refer to the diagram below, which shows a food web in the sea :

Which organism(s) is/are the secondary consumer ?
Questions 52 and 53 refer to the diagram below, which shows a food web in the sea :
If the seawater contains a trace amount of DDT (a pesticide), which organism may have the highest concentration of DDT in its body ?
Which of the following are the functions of the amniotic fluid in humans ?
If fertilizers in farmlands are drained into the sea, they may
Questions 56 and 57 refer to the graph below, which shows the cyclic changes in the populations of two animals, hare and lynx, in a certain area over a number of years :
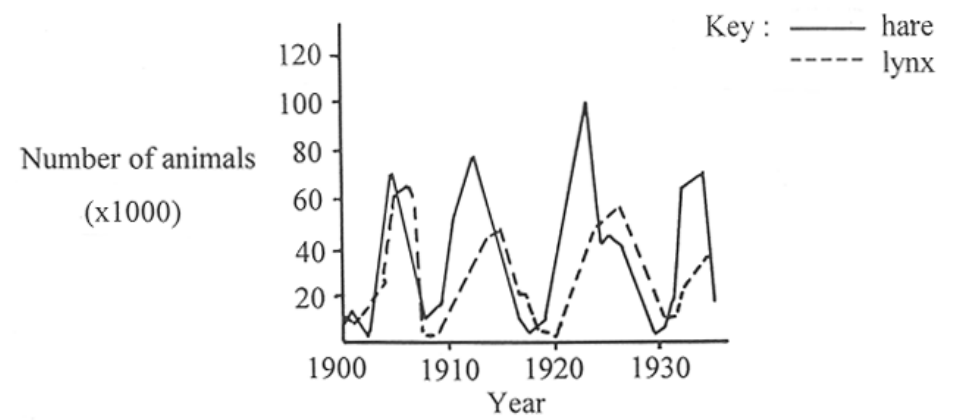
The pattern of changes in the populations of the two animals suggests that
Questions 56 and 57 refer to the graph below, which shows the cyclic changes in the populations of two animals, hare and lynx, in a certain area over a number of years :
In the same cycle, the peak of the lynx population is always lower than that of the hare population. This is because
Which of the following correctly describe the nutrition of bread mould and that of tapeworm ?
Questions 59 and 60 refer to the following information : In the early 1900s, Frederick Hopkins performed an experiment using rats. He divided young rats from the same litter (developed from a single pregnancy) into two groups. Group A was fed with purified protein, sugar, starch, fat, mineral salts and water. Group B received the same food plus 3 mL of milk each day. After 18 days, group A instead of group B was given the milk. The results of the experiment are shown in the graph below :
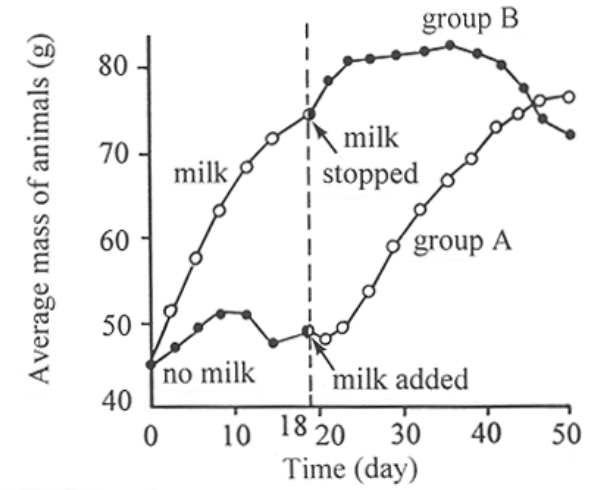
Based on the given information, what do you think was the aim of Hopkins’s experiment ?
Questions 59 and 60 refer to the following information : In the early 1900s, Frederick Hopkins performed an experiment using rats. He divided young rats from the same litter (developed from a single pregnancy) into two groups. Group A was fed with purified protein, sugar, starch, fat, mineral salts and water. Group B received the same food plus 3 mL of milk each day. After 18 days, group A instead of group B was given the milk. The results of the experiment are shown in the graph below :
In this experiment, Hopkins used rats from the same litter. This was to ensure that at the beginning of the experiment the two groups of rats