1993 年
生物 · 共 58 題 · 點擊選項即時核對答案
Questions 1 and 2 refer to the table below which shows some features of four plants :
| Plant | Flowers | Seeds | Chlorophyll |
|---|---|---|---|
| I | + | + | + |
| II | – | – | – |
| III | – | – | + |
| IV | – | + | + |
Key : + present – absent
Which of the following plants possesses the same features as Plant I ?
Questions 1 and 2 refer to the table below which shows some features of four plants :
| Plant | Flowers | Seeds | Chlorophyll |
|---|---|---|---|
| I | + | + | + |
| II | – | – | – |
| III | – | – | + |
| IV | – | + | + |
Key : + present – absent
Which of the plants is correctly classified ?
| Plant | Major Group | |
|---|---|---|
| I | ferns | |
| II | algae | |
| III | mosses | |
| IV | gymnosperms |
Questions 3 and 4 refer to the diagram below which shows cells at the root tip in various stages of cell division :
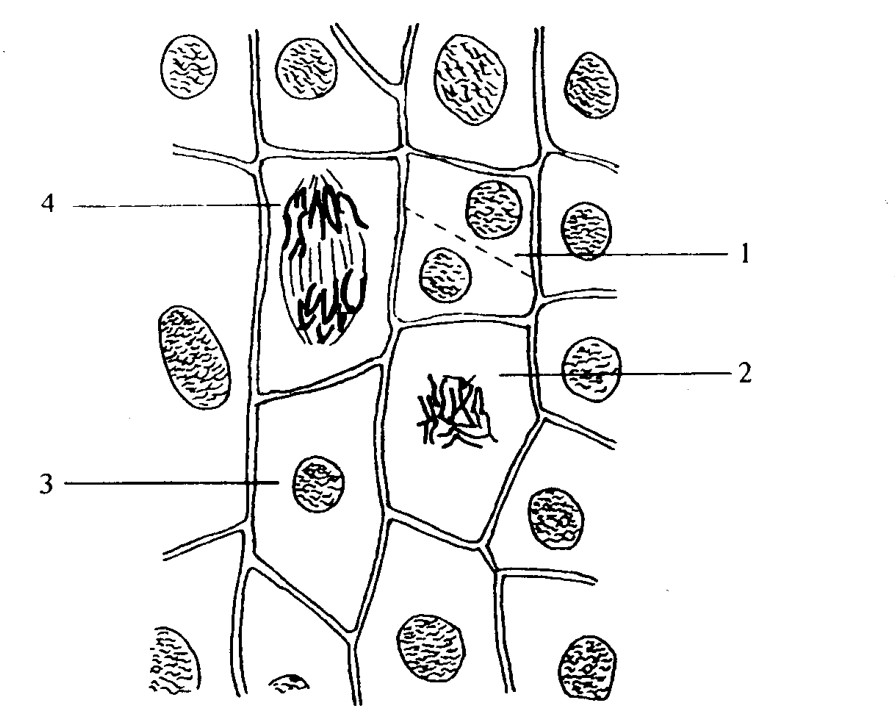
Which of the following is a correct sequence of the different stages of the cell division ?
Questions 3 and 4 refer to the diagram below which shows cells at the root tip in various stages of cell division :
This type of cell division occurs during the formation of
Four filter paper discs (I to IV) soaked with different solutions were put onto the surface of a starch agar plate as shown below :
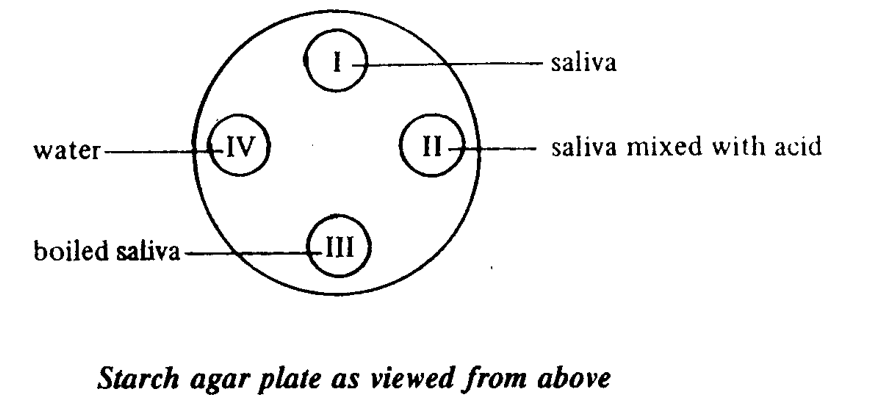
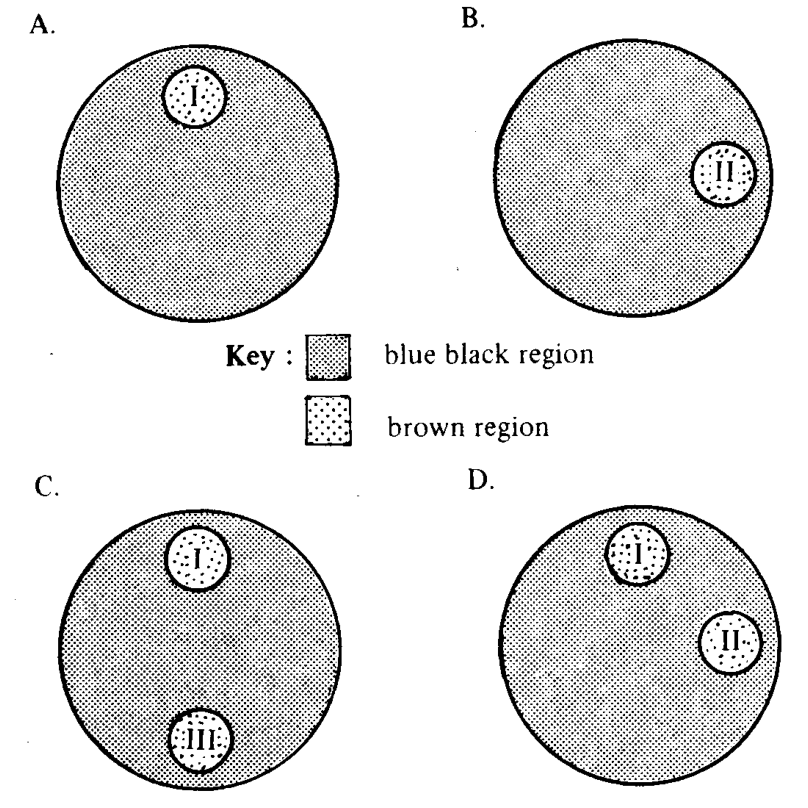
After incubation at 25°C for one hour, the paper discs were removed and the starch agar plate was flooded with iodine solution. Which of the following shows the probable result ?
Which of the following descriptions of the different parts of a plant cell are correct ?
The following table shows the percentage changes in mass of four groups of potato strips which have been immersed separately in four different solutions (I to IV) for one hour :
| Solution | Percentage change in mass |
|---|---|
| I | +5% |
| II | –5% |
| III | –3% |
| IV | 0% |
Which of the following conclusions can be drawn ?
When compared with woody plants, young herbaceous plants are less tolerant to a temporary shortage of water supply because
Questions 10 and 11 refer to the experimental set-up shown below :
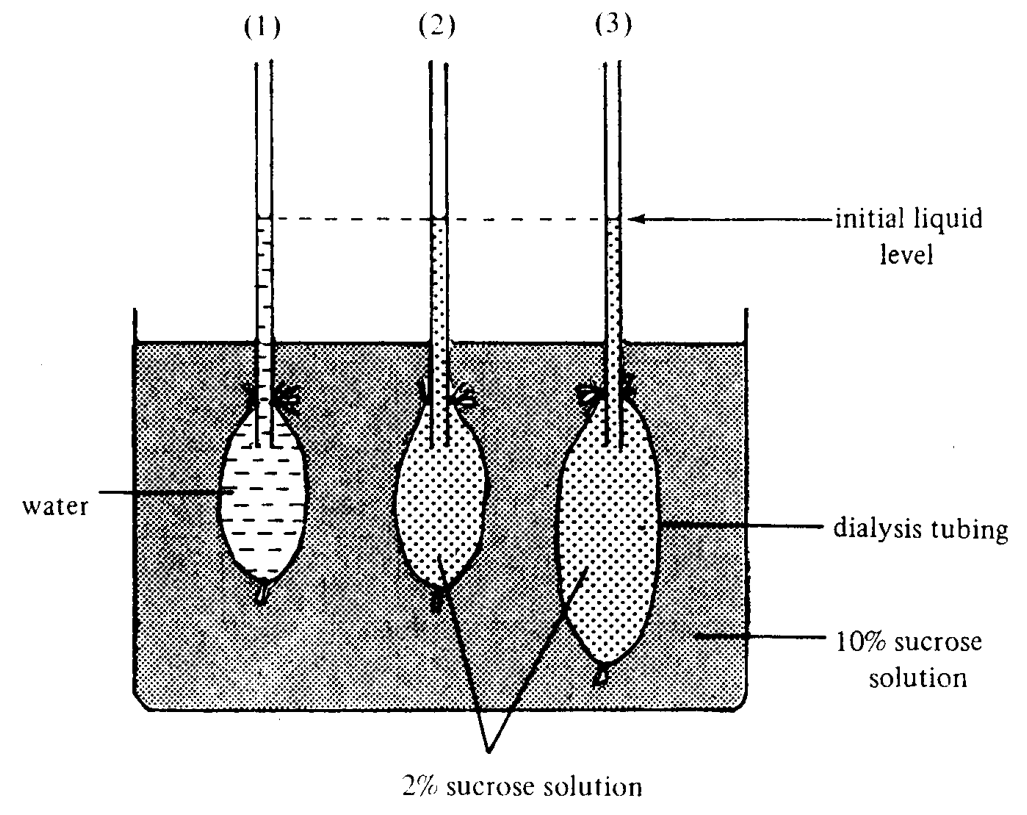
What will happen to the liquid levels in tubings (1) and (2) after one hour ?
| Tubing (1) | Tubing (2) | |
|---|---|---|
| fall | fall | |
| fall | rise | |
| rise | rise | |
| rise | fall |
Questions 10 and 11 refer to the experimental set-up shown below :
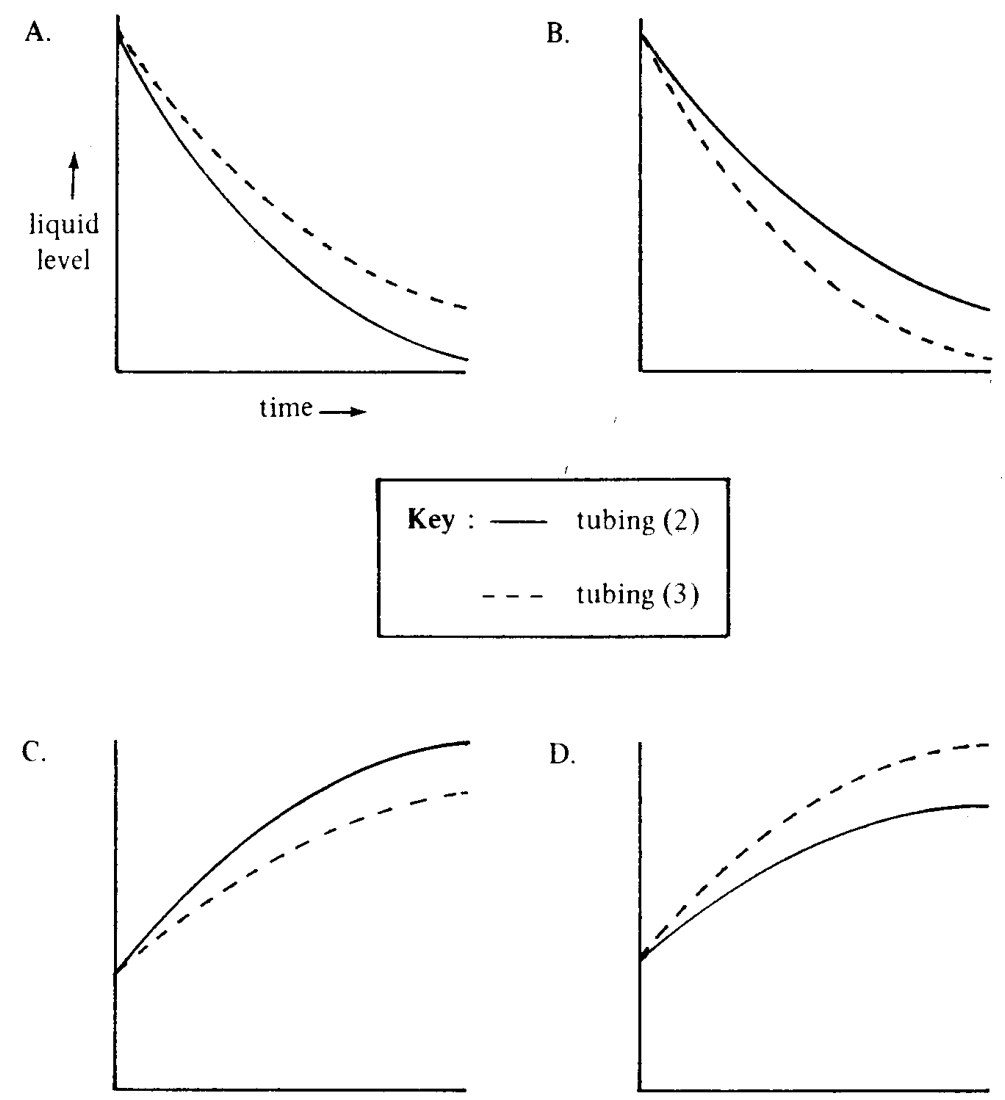
Which of the following graphs shows the likely changes in liquid level in tubings (2) and (3) ?