國民收入
經濟 · 共 98 題 · 點擊選項即時核對答案
The following diagram shows a production chain of garments in an economy. It also indicates the selling price of the output in different stages of the production. The imported raw materials are worth $6 000.
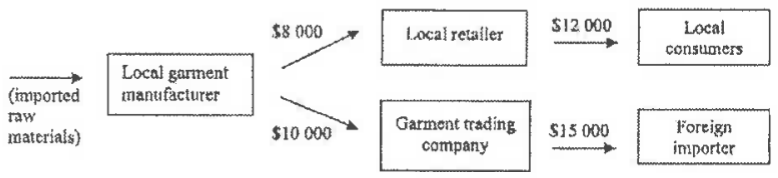
Suppose the garment trading company has received $1 000 export subsidy from the government. What is the contribution of the above production chain to the economy's GDP at factor cost?
Which of the following items can be negative in value?
Study the following table and answer questions 26 and 27.
| GDP Items | $ billion |
|---|---|
| Private consumption expenditure | 100 |
| Gross domestic fixed capital formation | 200 |
| Changes in inventories | -50 |
| Depreciation | 10 |
| Government consumption expenditure | 150 |
| Transfer payments | 20 |
| Indirect taxes | 100 |
| Subsidies | 40 |
| Net exports of goods and services | -15 |
The GDP at market price is $________ billion.
Study the following table and answer questions 26 and 27.
| GDP Items | $ billion |
|---|---|
| Private consumption expenditure | 100 |
| Gross domestic fixed capital formation | 200 |
| Changes in inventories | -50 |
| Depreciation | 10 |
| Government consumption expenditure | 150 |
| Transfer payments | 20 |
| Indirect taxes | 100 |
| Subsidies | 40 |
| Net exports of goods and services | -15 |
The GDP at factor cost is $________ billion.
The following diagram shows a production chain of computers in an economy. It involves the import of $6 000 worth of raw materials.
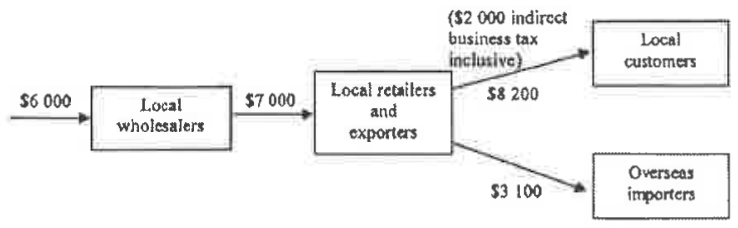
What is the contribution of the above production chain to the economy's GDP at factor cost ?
The per capita real GDP of a country would overstate the living standard of its people because it
Which of the following amounts should be deducted from the GDP of Hong Kong in order to calculate the gross national product of Hong Kong?
Year-on-year percentage change:
| Year | GDP at current market prices | GDP at constant (2000) market prices |
|---|---|---|
| 2007 | 9.5% | 6.4% |
| 2008 | 3.8% | 2.4% |
Based on the above information, we can conclude that in 2008,
Refer to the following circular flow of Economy A:
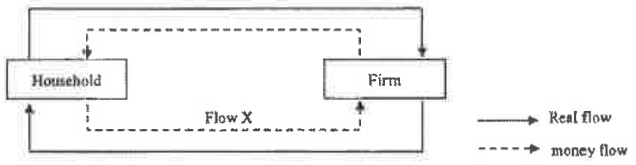
Flow X represents
The following diagram shows a production chain of computers in an economy. It involves the import of $5 000 worth of raw materials.

What is the contribution of the above production chain to the economy's gross domestic product (GDP) at factor cost?